排名问题中的评估指标
Ranking Problems
In many domains, data scientists are asked to not just predict what class/classes an example belongs to, but to rank classes according to how likely they are for a particular example.
在许多领域,数据科学家不仅被要求预测一个示例属于哪个类别,还应根据特定示例对它们进行分类的可能性来对类别进行排名。
| Classification | Ranking |
|---|---|
| Order of predictions doesn’t matter | Order of predictions does matter |
This is often the case because, in the real world, resources are limited.
这是经常发生的情况,因为在现实世界中,资源是有限的。
This means that whoever will use the predictions your model makes has limited time, limited space. So they will likely prioritize.Some domains where this effect is particularly noticeable:
这意味着对于预测出的结果,任何人只能有限的空间以及时间,所以他们更倾向于优先级高的。在一些特定领域尤其明显:
• Search engines: Predict which documents match a query on a search engine.
• Tag suggestion for Tweets: Predict which tags should be assigned to a tweet.
• Image label prediction: Predict what labels should be suggested for an uploaded picture.
• 搜索引擎:预测哪些文档匹配搜索引擎上的查询。
• 推文标签建议:预测应将哪些标签分配给推文。
• 图像标签预测:预测应该为上传的图片建议哪些标签。
If your machine learning model produces a real-value for each of the possible classes, you can turn a classification problem into a ranking problem.
如果机器学习模型为每一个类生成一个可能的实数,那么就可以将一个分类问题转化为排名问题。(个人感觉有一种硬分类和软分类的意味。)
In other words, if you predict scores for a set of examples and you have a ground truth, you can order your predictions from highest to lowest and compare them with the ground truth:
换句话说,如果预测一组示例的得分并且有基本事实,则可以将预测从最高到最低排序,并将它们与基本事实进行比较
• Search engines: Do relevant documents appear up on the list or down at the bottom?
• Tag suggestion for Tweets: Are the correct tags predicted with higher score or not?
• Image label prediction: Does your system correctly give more weight to correct labels?
• 搜索引擎:相关文档是否出现在列表的顶部或底部?
• 推特的标签建议:是否以较高的分数预测了正确的标签?
• 图像标签预测:系统是否正确地赋予了正确标签更多的权重?
In the following sections, we will go over many ways to evaluate ranked predictions with respect to actual values, or ground truth.
在以下各节中,我们将介绍许多方法来评估关于实际值或基本事实的排名预测。
Sample dataset (Ground Truth)
We will use the following dummy dataset to illustrate examples in this post:
使用以下虚拟数据集来说明本文中的示例: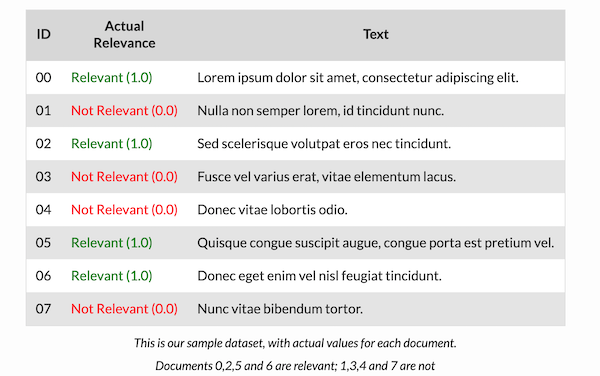
Precision @k
Precision @k is simply precision evaluated only up to the k-th prediction, i.e.:
Prec@K表示设定一个阈值K,在检索结果到第K个预测例子为止,排序结果的查准率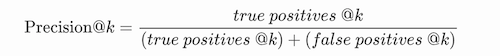
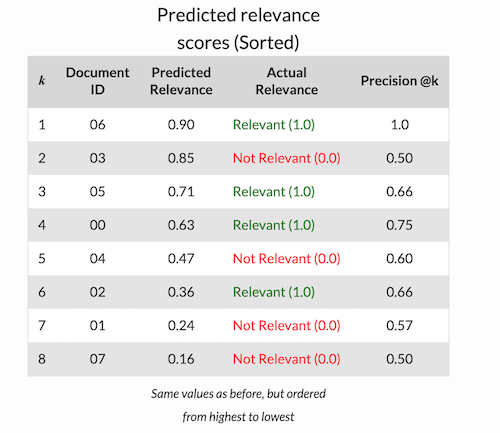
例子: Precision @1 = 1/1 =1 , Precision @4 = 3/4 =0.75, Precision @8 = Precision = 4/8 = 0.5
Recall @k
Recall @k is simply Recall evaluated only up to the -th prediction, i.e.:
Recall@K表示设定一个阈值K,在检索结果到第K个预测例子为止,排序结果的查全率
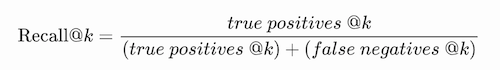
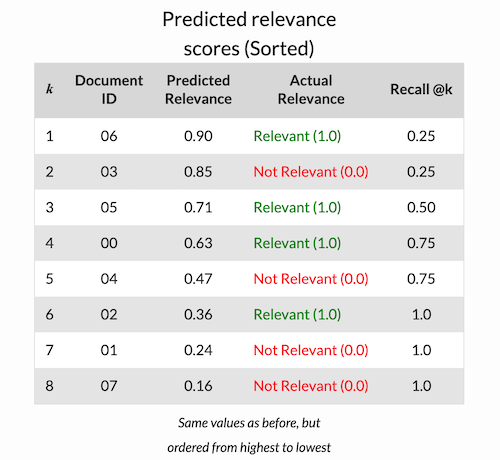
例子: Recall @1 = 1/4 =0.25 , Recall @4 = 3/4 =0.75, Recall @8 = Recall = 4/4 = 1
F1 @k
F1 @k is a rank-based metric that can be summarized as follows: “What F1-score do I get if I only consider the top k predictions my model outputs?
F1@K表示设定一个阈值K,在检索结果到第K个预测例子为止,排序结果的F1-score
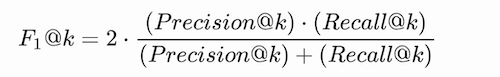
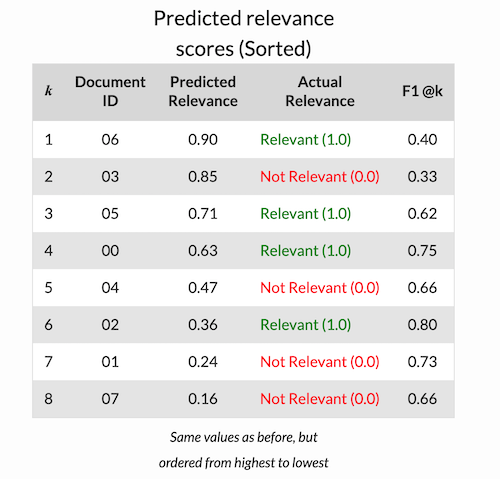
例子: F1 @1 = 2x (1/1 * 1/4 )/(1/1+1/4) = 0.4
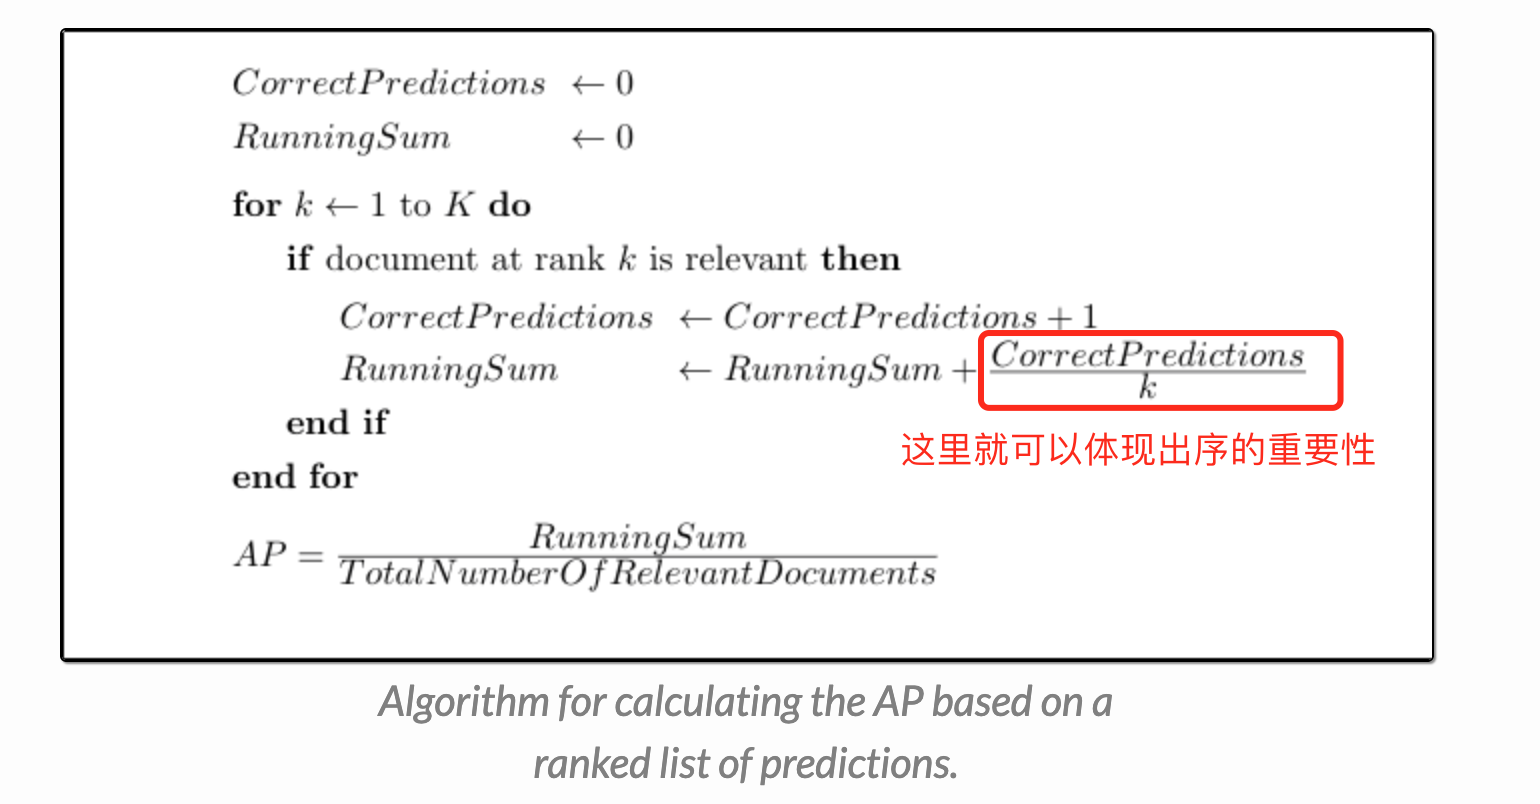
AP (Average Precision)
AP is a metric that tells you how much of the relevant documents are concentrated in the highest ranked predictions.
AP是一种指标,它告诉您有多少相关文档集中在排名最高的预测中。
So for each threshold level (k) you take the difference between the Recall at the current level and the Recall at the previous threshold and multiply by the Precision at that level. Then sum the contributions of each.
因此,对于每个阈值级别(k),需要取当前级别的Recall和前一个阈值的Recall之间的差,然后乘以该级别的Precision,最后求和。
为什么会有AP?
precison只是考虑了返回结果中相关文档的个数,没有考虑文档之间的序。对一个搜索引擎或推荐系统而言返回的结果必然是有序的,而且越相关的文档排的越靠前越好,于是有了AP的概念。
MAP (Mean Average Precision)
AP (Average Precision) is a metric that tells you how a single sorted prediction compares with the ground truth. E.g. AP would tell you how correct a single ranking of documents is, with respect to a single query.
AP可以得到单个排序的预测与基本事实进行比较。例如,对于单次查询得到的排序结果的文档到底有多正确。所以可以对所有的AP取平均得到MAP
AP: Informs you how correct a model’s ranked predictions are for a single example
MAP: Informs you how correct a model’s ranked predictions are, on average, over a whole validation dataset.
本博客所有文章除特别声明外,均采用 CC BY-SA 4.0 协议 ,转载请注明出处!