知识图谱简介
什么是知识图谱?
- Knowledge in graph form!
- Captures entities, attributes, and relationships
- Nodes are entities
- Nodes are labeled with attributes (e.g., types)
- Typed edges between two nodes capture a relationship between entities
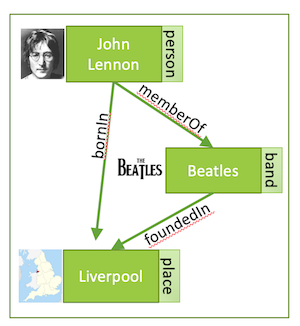
简单的说,知识图谱就是一张图,用来描述节点之间的关系。
知识图谱的来源?
- Structured Text (Wikipedia Infoboxes, tables, databases, social nets)
- Unstructured Text (WWW, news, social media, reference articles)
- Images
- Video (YouTube, video feeds)
知识图谱如何被使用?
Human perspective:
- Combat information overload
- Explore via intuitive structure
- Tool for supporting knowledge-driven tasks
AI perspective:
- Key ingredient for many AI tasks
- Bridge from data to human semantics
- Use decades of work on graph analysis
常见的应用:
- QA/Agents
- Decision Support
- Fueling Discovery
工业界的使用包括: Google Knowledge Graph(Google Knowledge Vault), Amazon Product Graph, Facebook Graph API, IBM Watson, Microsoft Satori, LinkedIn Knowledge Graph, Yandex Object Answer, Diffbot, GraphIQ, Maana, ParseHub, Reactor Labs, SpazioDati
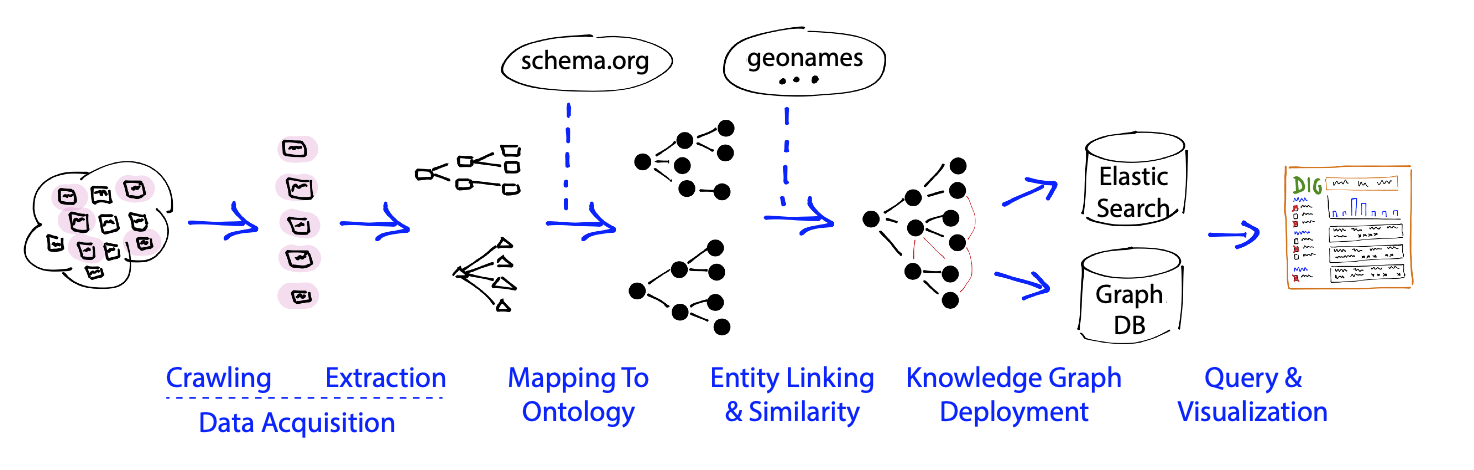
典型的知识图谱架构?
基本流程如下:
- 数据获取
- 信息提取
- 本体映射
- 实体解析
- 知识图谱的部署
- 图谱具体应用
本博客所有文章除特别声明外,均采用 CC BY-SA 4.0 协议 ,转载请注明出处!