知识图谱表格理解
数据类型
- Structured Data
- Knowledge Graphs
- The Semantic Web
- Databases
- Structured files (CSV, XML, XLS)
- Structures in HTML, e.g. tables -> 本章关注
- Unstructured Data
Web中的结构化表格 (Structured Tables on the Web)
Tables contain really useful data
Vast Amount of Data in Tabular Form
表格类型

Listing
Horizontal Listings; -> 类似于excel表格的形式,每一行表示某个item的信息
Vertical Listings; -> 类似于Dell、Apple商品展现的形式,每一列表示某个item的信息
Attribute/Value Tables
类似于Wikipedia的展现形式,其本质就是一个k-v的字典
Matrix
二维表格,第一行和第一列都描述了元信息
same value type for any cell
Enumeration
list series of objects with the same ontological relation;
major challenge: discovery of the predicate;
本质上就是一个list,然后其中包含了某一个属性下的列表信息。
Form
like attribute-value;
with missing values;
which are filled by a user
也就是日常见到的表单
Navigational
purpose: navigate within or outside of a site
no clear relations between the cells
也就是网站上常见到一系列可以点击的网页链接放在一块的展示
Formatting
purpose: organize data visually
主要是一些布局展示
表格的属性
Global Layout features
• #rows, #cols, max cell length
Layout features (per row/column)
• cell length, length variance, ratio in col/rowspan
HTML features (content)
• unique tags, ratio of th/anchor/img/input/br/font…
Cell features (content)
• unique strings, end-with-colon, is/contains number, non- blank
提取关系数据 (Extracting Relational Data)
目标:
找到表格中的结构化关系
提取出表格下的RDF三元组
关键:
• What is the semantic type of each column? • Semantic Labeling 列的含义
• What is the subject of the table? • Entity Linking 表格中主体寻找
• What predicates describe the relationships in the table? • Semantic Modeling 单元格的关系建立
提取定量数据 (Extracting Quantitative Data)
• What is quantitative data?
• How is it harder than relational data?
• How is it easier than relational data?
• What is important to represent about this data?
Quantitative data
Quantitative data is defined as the value of data in the form of counts or numbers where each data-set has an unique numerical value associated with it.
Key idea:
• Measure: the thing we want to measure
• Attributes: help us understand what we’re measuring
• Dimensions: values that are varied across measurements
• Observation: The actual value we measured
Measure表示我们需要衡量什么,比如说温度
Attributes表示我们衡量的这个东西具有的属性,比如说那一天的温度、那个海拔高度的温度、温度的单位
Dimensions表示随着这个东西的改变,衡量的值会不同,比如说地点
Observation表示就是观测值,比如说30度
挑战
Attributes有哪些?
Dimensions有哪些?
Value是什么?
需要做很多操作,例如
Metadata Detection, Separation between header and values, Detecting layouts, Detecting dependent rows/columns, Filling the implicit values, Recognizing null values ….
核心任务
Three core tasks across all table understanding tools:
Classify Cell Type;
Identify Blocks;
Detect Layout;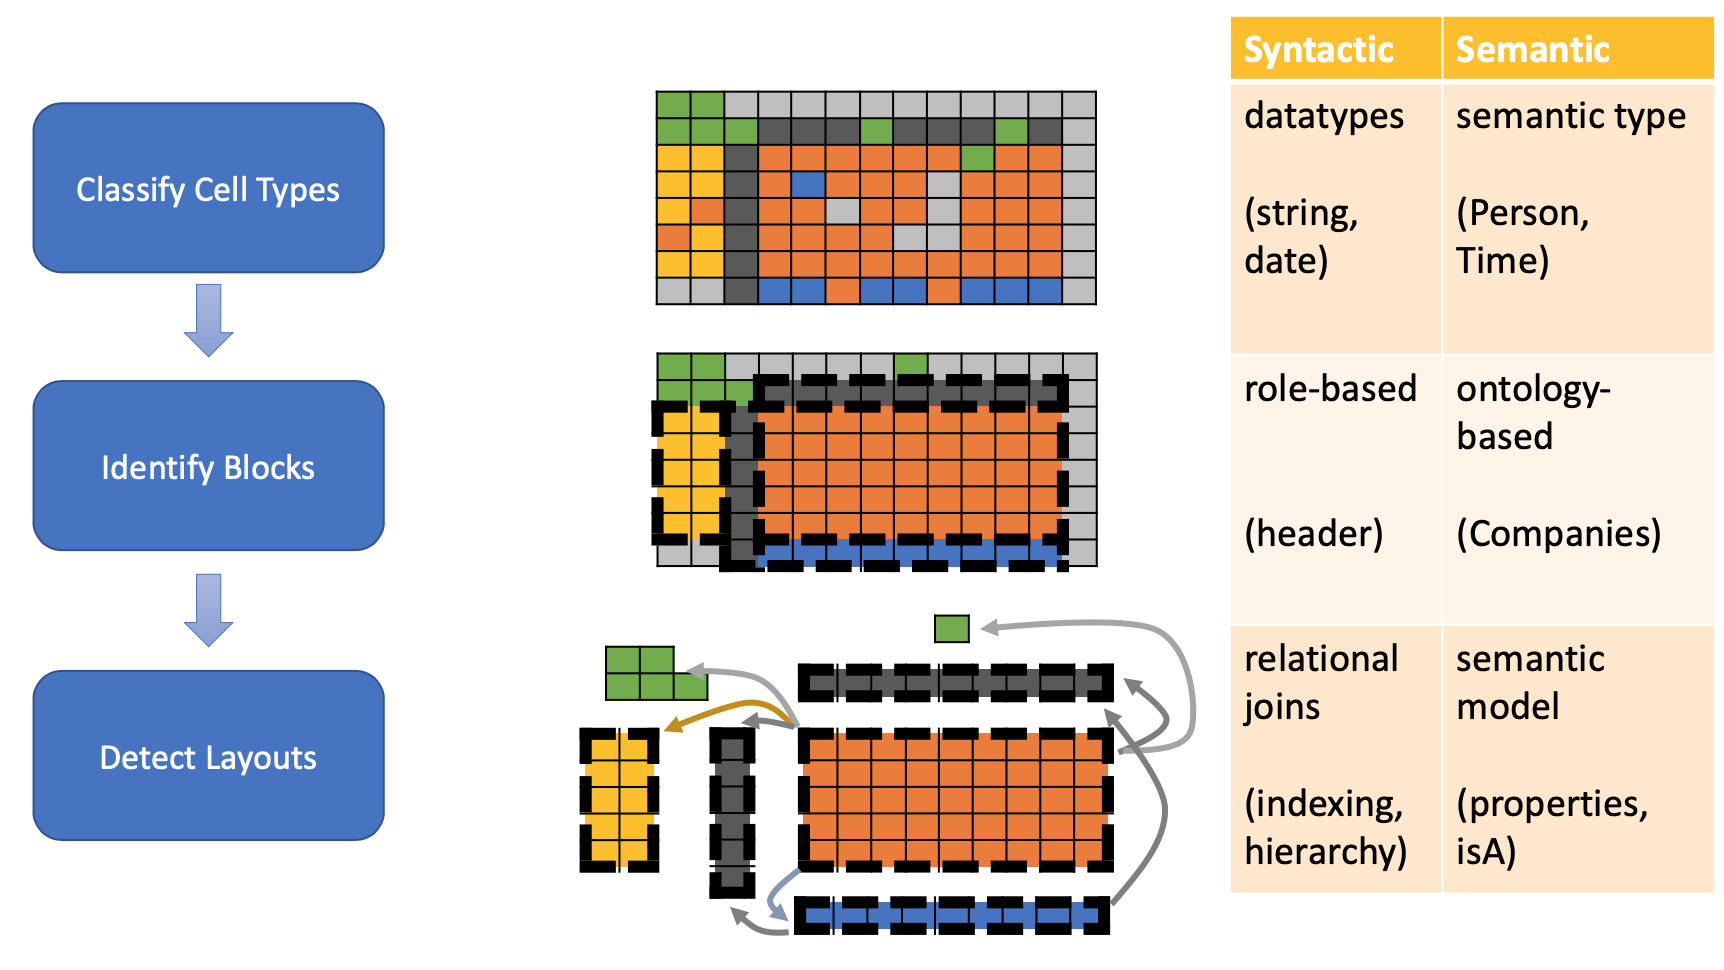
本博客所有文章除特别声明外,均采用 CC BY-SA 4.0 协议 ,转载请注明出处!